This guide has been designed to accompany the ECG quizzes located elsewhere on this site.
All of the examples in this guide have been kindly provided by Dr Smith's ECG blog.
Please click on one of the questions below to learn more.
Myocardial infarction (MI) is the term for a coronary artery occlusion that threatens ischaemic injury to the myocardium.
When the arterial blockage is total or near-total, the full thickness of the downstream myocardium is at risk. Emergency reperfusion therapy is required to avoid irreversible damage. This can be achieved with thrombolytic drugs or cardiac catheterisation.
The current guideline-recommended paradigm for management of acute MI divides patients into two familiar groups: those who demonstrate ST-segment elevation (STEMI) on their ECG and those who do not (NSTEMI).
According to this paradigm, patients who meet the STEMI criteria have sustained a complete coronary occlusion requiring immediate reperfusion. Those who do not, have not.
In reality, myocardial infarction is an electrically complex process. When it does manifest ECG signs, they are intricate, time-sensitive, and patient-dependent. The earliest stages of ischaemia routinely fail to ST-elevation and an artery can progress from occlusion back to reperfusion or towards infarction without ever meeting STEMI criteria.
Unsurprisingly, then, the STEMI criteria have low accuracy. They routinely miss at least 25% of fully occlusive cardiac lesions in patients classified as "NSTEMI." Furthermore, use of the term "STEMI" discourages clinicians from looking for (and teaching!) other red-flag ECG patterns associated with MI.
Overall, the term "STEMI" has outstayed its welcome in acute and emergency medicine. Increasingly preferred is the term 'occlusive myocardial infarction' (OMI), which directly describes pathology and encourages clinicians to consider a wider range of red-flag ECG abnormalities.
The posterior myocardium is perfused by either the left circumflex artery or right coronary artery. Accordingly, posterior infarction is most commonly seen as a complication of inferior or lateral OMI.
Isolated posterior infarction is relatively uncommon, comprising up to 8.5% of all OMI. The diagnosis is frequently missed because in these cases there is an absence of ST-elevation on a standard 12-lead ECG.
ST-depression maximal in V1-4 (Fig. 1) is a highly specific ECG finding for posterior OMI. In the right clinical context, this pattern of ST-depression is an indication for immediate reperfusion therapy, as it is reciprocal to ST-elevation that is not captured on a standard 12-lead ECG.
Additional ECG leads ("V7-9") can be added to uncover this hidden ST-elevation in posterior OMI (Fig. 2). The leads are placed on the left posterior chest wall in the same horizontal plane as V6.
Posterior leads should only be used as a "rule-in" test when posterior OMI is suspected: the absence of discernible ST-elevation in V7-9 does not rule-out the diagnosis if there are abnormalities in V1-4.
Further examples are provided below (Figs. 3-8).


The inferior myocardium sits on the diaphragm. It is usually perfused by the right coronary artery (80%) but may be perfused by the left circumflex artery (18%).
Inferior OMI may present with ST-elevation in II, III, and aVF -- but an equally important sign to look out for is ST-depression in aVL, which is the only lead that is reciprocal to the inferior myocardium (Fig 1).
ST depression in aVL is more common in inferior OMI than ST-elevation. The majority of "subtle" inferior OMIs that do not meet STEMI criteria do demonstrate ECG changes in aVL.
Infarction of the right ventricle (RV) complicates approximately 40% of inferior OMI. It is important to look for this complication, as these patients have impaired RV contractility and are highly dependent on preload to maintain output. Fluid boluses may be needed, and nitrates are contraindicated.
In patients with inferior OMI, RV infarction is indicated by one or more of the following:
- ST-elevation in V1
- ST-depression in V2
- ST-elevation that is greater in III than II
An example of these findings is provided below (Fig 2).
To confirm RV infarction, a right-sided 12-lead ECG may be used. This is performed by placing the ECG leads in their usual positions, but on the right side of the body instead of the left. The most helpful lead is the right-sided V4. ST-elevation in this lead is highly sensitive and specific for RV infarction (Fig. 3).
Further examples are provided below (Figs. 4-8)


The T-wave is generated by ventricular repolarisation. Normal T-waves are short, narrow, and asymmetrical. They are rarely taller than one large square in the limb leads, or two large squares in the chest leads.
Hyperacute T-waves, in contrast, are tall, broad, and symmetrical (Fig 1). They indicate abnormal repolarisation of the ischaemic ventricle. Hyperacute T-waves frequently occur before the development of ST-segment changes and may remain the dominant feature of occlusion in their absence
Typically, hyperacute T-waves appear in several contiguous leads. They may be associated with inverted or biphasic T-waves in reciprocal leads.
If the preceding QRS complex is low-voltage, hyperacute T-waves may have a height that is normal in absolute amplitude, but tall relative to the QRS (Fig 2). In these cases, pay particular attention to the shape and distribution of the T-waves.
Further examples are provided below (Figs. 3-8).


The Q-wave is defined as a negative deflection preceding the R-wave. It represents depolarisation of the interventricular septum.
Small Q-waves are a normal feature of most ECGs, although they are not generally seen in leads V1-3.
"Pathological" Q-waves may be recognised by their unusually wide and deep appearance (Figs. 1-8). They take on this abnormal morphology when depolarisation occurs within ischaemic or scarred septal myocardium. As such, their presence on the ECG may signal acute OMI or a prior infarct.
In a patient with chest pain or cardiogenic shock, the presence of pathological Q-waves should be interpreted as acute OMI unless a prior ECG can be found to prove otherwise!


The de Winters pattern is characterised by hyperacute T-waves originating from a depressed, up-sloping ST segment (Figs. 1-7).
This pattern is pathognomic for an extreme thrombotic stenosis of the LAD (~99%) with only a trickle of flow remaining to the anterior and apical myocardium.
This residual flow should not be understood as "reperfusion" as it is insufficient and may terminate at any time. These patients require immediate treatment.
The presence of the de Winters pattern indicates high risk of transition to occlusive infarction.


In leads V2-3, we expect the R-wave to be followed by an S-wave, which is the first negative deflection below the isoelectric line occurring after the R-wave. The P-Q interval can be used as a point of reference.
In some cases, we may see a J-wave instead of an S-wave. A J-wave is a positive deflection that occurs after the R-wave. J-waves are commonly seen in benign early repolarisation.
Terminal QRS distortion is defined as an absence of an S-wave or a J-wave in V2-3 (Fig. 1-3). It may be accompanied by subtle ST elevation.
We should never see terminal QRS distortion in V2-3 in cases of normal variant ST elevation, such as benign early depolarisation, but it is often present in anterior OMI.
Indeed, multiple studies suggest that the presence of terminal QRS distortion signals a larger anterior infarct with higher mortality and poor response to reperfusion therapy.


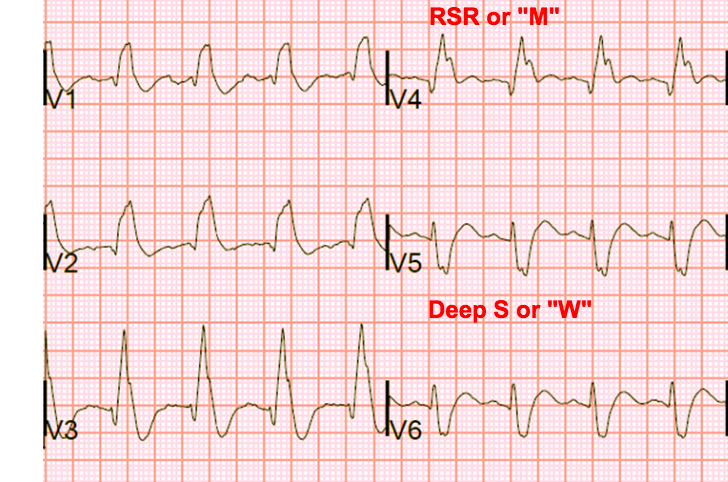
The heart's electrical conduction system terminates with three main branches or 'fascicles.'
The first is the fascicle in the right ventricle: the 'right bundle branch.'
The second and third are the fascicles in the left ventricle: the left anterior fascicle and the left posterior fascicle, which are collectively referred to as the ‘left bundle branch.’
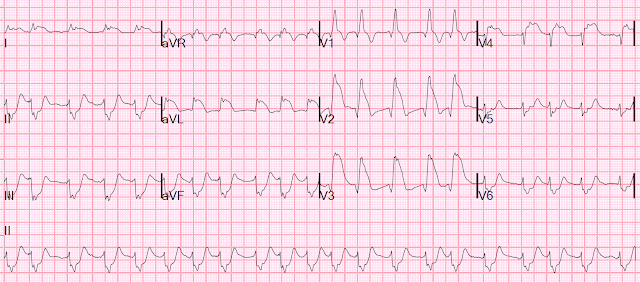
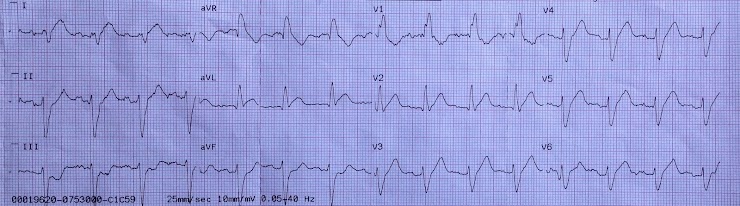
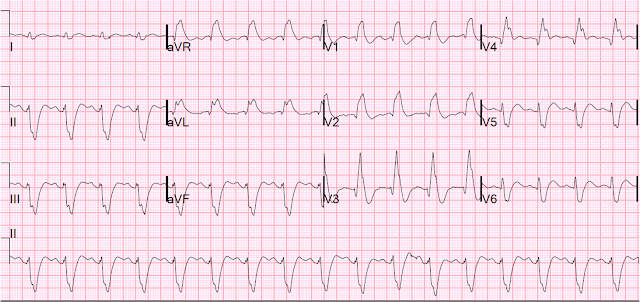
Bifasicular block is the term for conduction delay in two of the three fascicles. The most common pattern of bifasicular block is right bundle branch block (RBBB) + left anterior fascicular block (LAFB). An annotated example is provided below (Fig. 1)
LAFB is indicated by the presence of left axis deviation, qR complexes in the high lateral leads, and rS complexes in the inferior leads (see Fig. 2). RBBB has a characteristic appearance (see Fig 3.) involving a prolonged QRS, an RSR pattern in the anteroseptal leads ("M") and a wide S-wave in the lateral leads ("W").
In the context of chest pain, LAFB + RBBB is highly associated with proximal occlusion of the LAD. This is because the proximal branches of the LAD perfuse the left anterior fascicle and the right bundle branch.
LAFB + RBBB occurs in 5-7% of acute anterior OMI. In roughly a third of these cases, the block will be unaccompanied by ST-segment changes.
When confronted by this ECG pattern in a patient with chest pain or cardiogenic shock, assume OMI until proven otherwise!
Further examples are provided below (Figs. 4-8)


Shallow, monophasic T-wave inversion in leads V2-3 is a non-specific sign of ischaemia to the anterior myocardium.
In contrast: deeply inverted or biphasic T-waves in V2-3 signal a specific pattern of LAD occlusion and reperfusion known as the Wellens pattern.
Biphasic ("up-down") T-wave inversion in V2-3 is categorised as "Wellens A" pattern (Fig. 1). Deep T-wave inversion in V2-3 is categorised as "Wellens B" pattern (Fig. 2). R-waves are usually preserved in either pattern. Patients may alternate between these two patterns or demonstrate both in the same ECG.
The Wellens ECG is typically seen in patients whose chest pain has resolved, and who have normal or minimally elevated troponin. Their LAD has occluded, causing pain, but has re-perfused by the time the ECG is taken — perhaps due to prehospital aspirin, or endogenous clot lysis.
If re-occlusion occurs, the Wellens pattern will be replaced by "pseudo-normalised" T-waves in V2-3 (Fig. 3). Pseudo-normalised T-waves can be thought of as hyperacute T-waves emerging from a negative baseline.
A "Wellens-like" reperfusion pattern can also be found in the inferior leads (Fig. 4)


Accelerated idioventricular rhythm (AIVR) occurs when the firing rate of an ectopic ventricular pacemaker is higher than that of the sinoatrial node.
AIVR appears as a broad complex rhythm with a rate that is too slow to be ventricular tachycardia, but too fast for the ventricular escape rhythms seen in severe heart block (Figs. 1-7). There will be no pacing spikes or bundle branch block morphology.
The abnormal ventricular pacemaker can become active during reperfusion after OMI. AIVR is therefore seen in patients who have been thrombolysed or stented, and in this context, it is a benign, self-limiting phenomenon. Haemodynamic compromise is unlikely.
However, in patients who have not been treated, AIVR is a highly concerning ECG pattern: it signals that there has been a total coronary occlusion. Some reperfusion may have occurred, but the patient is at imminent risk of re-occlusion and OMI.
Anti-arrythmics should be avoided in AIVR.


Critical stenosis of the left main stem or proximal LAD will cause widespread subendocardial ischaemia. The artery is open, but flow is insufficient for full-thickness myocardial perfusion. This problem is also seen in severe triple vessel disease.
In such cases the ECG will show a characteristic pattern of ST-elevation in aVR with reciprocal ST-depression in nearly every other lead (Fig 1-7).
It is important to recognise that this pattern is non-specific. It is also seen, for example, in tachyarrythmias, sepsis, gastrointestinal bleeds, pulmonary embolism, and aortic dissection. Any pathology that causes a supply / demand mismatch in the subendocardial muscle is a potential cause.
Although these ECG findings do not suggest acute OMI, emergent angiography is usually required if the cause is suspected to be an acute coronary syndrome, and the patient is not improving with medical therapy.